DebuggingProgramCrash
|
Size: 9703
Comment: fix linebreak
|
Size: 9703
Comment: update key ID for new ddebs.ubuntu.com GPG key
|
| Deletions are marked like this. | Additions are marked like this. |
| Line 63: | Line 63: |
| sudo apt-key adv --keyserver keyserver.ubuntu.com --recv-keys 428D7C01 | sudo apt-key adv --keyserver keyserver.ubuntu.com --recv-keys 5FDFF622 |
Available languages: Italiano,
This page is part of the debugging series — pages with debugging details for a variety of Ubuntu packages. |
Introduction
This document describes how to install debug packages on Ubuntu, allowing one to provide information regarding providing detailed information when manually performing:
A Backtrace.
A Valgrind, if the program crashes with a "Segmentation fault" or "Bus error".
An Strace.
Using apport-retrace
If you want to debug a crash in packaged Ubuntu software, Apport will usually pick it up, create a .crash report in /var/crash/ and report the crashed program. From there it is easiest to use apport-retrace.
apport-retrace regenerates the stack traces (both the simple and the threaded one) from an apport crash report from the included core dump, or gives you a Terminal window with gdb in an environment with debugging symbols, reproducing the situation of the crash through the core dump. For this it figures out the set of necessary packages and their accompanying debug symbol packages, so that the regenerated stack trace will be fully symbolic and thus become much more useful for developers to fix the problem.
apport-retrace has two modes: By default it will just regenerate traces based on the packages which are currently installed in the system, i. e. it assumes that all necessary debug symbols for the report are installed (see the next paragraph for this). When specifying the -S option, it creates a temporary "sandbox" and downloads and installs all necessary packages and debug symbols there. It will not do any changes to your system and does not require any special privileges.
Please see the apport-retrace manpage for details and some examples how to run it.
You can also invoke this directly from the Apport crash notification, by clicking the "Examine locally" button:
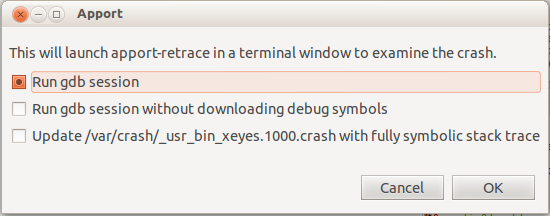
This will collect some package information and then ask you in which mode you want to run apport-retrace:
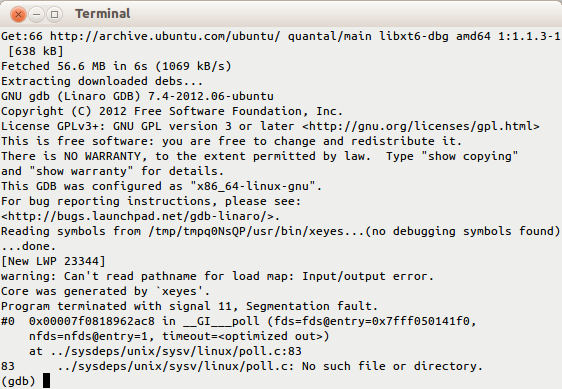
Normally you want to keep the first option, which will get you in a gdb session in the sandbox:
If you do not want an interactive gdb session but just want it to update the already existing .crash file with fully symbolic stack traces, you can select the third option.
Installing debug symbols manually
If you want to debug a crash from an application provided by Ubuntu, you are developing yourself, provided by a third-party, or need the debug symbols for particular libraries very often, it is helpful to install the relevant debugging packages.
Built-in debug symbol packages (*-dbg)
For many, but not all, packages, one can simply add a -dbg suffix to the package name to install it. For example:
sudo apt-get install xserver-xorg-core-dbg
Non-built-in debug symbol packages (*-dbgsym)
For additional debug symbols that are not built-in, one must add an additional repository. ![]() Please take care to not install both debug symbols for a given package name, as this may cause problems. Your package manager will not check for this overlap and prevent it from happening. For example:
Please take care to not install both debug symbols for a given package name, as this may cause problems. Your package manager will not check for this overlap and prevent it from happening. For example:
libprotobuf-c1-dbg
libprotobuf-c1-dbgsym
Here are the steps to add this repository:
Create an /etc/apt/sources.list.d/ddebs.list by running the following line at a terminal:
echo "deb http://ddebs.ubuntu.com $(lsb_release -cs) main restricted universe multiverse" | sudo tee -a /etc/apt/sources.list.d/ddebs.list
Stable releases (not development, alphas, or betas) require two more lines adding to the same file, which is done by the following terminal command:
echo "deb http://ddebs.ubuntu.com $(lsb_release -cs)-updates main restricted universe multiverse deb http://ddebs.ubuntu.com $(lsb_release -cs)-proposed main restricted universe multiverse" | sudo tee -a /etc/apt/sources.list.d/ddebs.list
You may also add these lines using the Synaptic Package Manager:Choose Synaptic via the System > Administration menu.
Choose Software Sources or Repositories via the Settings menu, and click on the Third-Party Software tab.
Click the Add button and enter each deb ... line as above one by one and click the Add Source button (you will have to add these lines one at a time).
Import the debug symbol archive signing key:
sudo apt-key adv --keyserver keyserver.ubuntu.com --recv-keys 5FDFF622
Then run:
sudo apt-get update
to update your package list or click the Reload button if you used the Synaptic Package Manager.
The debug symbol packages have the '-dbgsym' suffix attached, so to install the debug symbols for the yelp package, you first run:
apt-cache policy yelp
This will show you the version number currently installed (we'll use 2.22.1-0ubuntu2.8.04.1 in this example). NOTE: yelp (which is the package name of "Help and Support" located under the 'System' menu) is just an example, and would have to be replaced by the name of the package you want to debug.
Install the debug symbols:
sudo apt-get install yelp-dbgsym=2.22.1-0ubuntu2.8.04.1
You can also use the Synaptic Package Manager to search for yelp-dbgsym and install it from there.
Manually finding required debug symbols
The above procedure will install the debug symbol package for yelp only. For many packages, they use libraries shared between different packages. Hence, in order to obtain a readable/more readable stacktrace, or perform other debugging tasks, one must find the debug symbols for these shared libraries. For example, if one had attached gdb to an application and got the following output:
Reading symbols from /usr/lib/x86_64-linux-gnu/libffi.so.6...(no debugging symbols found)...done.
Loaded symbols for /usr/lib/x86_64-linux-gnu/libffi.so.6
This would indicate that the relevant debug symbols are not installed. However, this by itself wouldn't necessarily be enough information to know which package exactly needs the debug symbols. Hence, one may go to http://packages.ubuntu.com/ and paste into the "Search the contents of packages" keyword box:
x86_64-linux-gnu/libffi.so.6
choose the appropriate Distribution from the drop down, and click Search. This would reveal that the package is libffi6. A check in Synaptic reveals the debug package libffi6-dbg.
Automatically installing all debug symbols
This procedure would install every debug symbols, versus only the ones you may need, or are interested in. You can download the following shell script (list-symbols-packages-v2.1.sh) to resolve all the dependencies. Attaching a debugger to an already running process may require elevated privileges even if you own the process. The following invocation will print out the list of files to install.
sudo bash ./list-symbols-packages-v2.sh -p $(pidof yelp)
To automatically install them apt can be called with the input from the script. The script is invoked with -t for a terse output without the descriptions of the packages and error messages are suppressed:
sudo bash ./list-symbols-packages-v2.sh -t -p $(pidof yelp) 2>/dev/null | xargs -d $'\n' sudo apt-get install
![]() Version 2 of this script makes it compatible with the newer GDB (which no longer loads all libraries at startup by default). -v2 currently only works if you run it against a currently-executing binary (i.e., with '-p $(pidof <whatever>'). The older version of the script is also available.
Version 2 of this script makes it compatible with the newer GDB (which no longer loads all libraries at startup by default). -v2 currently only works if you run it against a currently-executing binary (i.e., with '-p $(pidof <whatever>'). The older version of the script is also available.
Uninstalling all debug symbols
You can remove all debug symbol packages and the ddebs repositories with the following commands:
sudo apt-get remove \.*-dbgsym \.*-dbg
sudo rm /etc/apt/sources.list.d/ddebs.list
sudo apt-get update
The Xorg server
Depending on the circumstances, X server will trap its own crashes and dump a stack trace in /var/log/Xorg.0.log. However, this stack trace is modified by the signal handler itself. If apport is not catching the crash, add this to your /etc/X11/xorg.conf:
Section "ServerFlags"
        Option "NoTrapSignals" "true"
EndSection
Please see X/Debugging for how to debug Xorg server crashes.
Info for the BugSquad
If you're trying to apport-retrace a crash report from a bug that didn't happen on the same Ubuntu release as the one you're running, it would be easiest to just virtualize the environment it is reproducible in. However, if this would not be available to you, one may perform the following example. Say that you're running Trusty and the crash happened on Precise:
This will create a minimal Precise system:
sudo mkdir -p /chroots/precise
sudo debootstrap precise /chroots/precise/
Now change into this minimal precise system:
sudo chroot /chroots/precise
- Edit /etc/apt/sources/list and add all the repositories you need, including the ddeb repository.
Execute the following in a terminal:
sudo apt-get update; sudo apt-get install gdb apport
- use apport-retrace as you're used to.
For more information on dealing with bug reports Apport see Bugs/ApportRetraces.
DebuggingProgramCrash (last edited 2022-12-20 22:13:06 by sergiodj)


