ServerMaverickMonitoringFramework
Launchpad Entry: server-maverick-monitoring-framework
Created:
Contributors:
Packages affected:
Summary
This specification outlines a standard way of collecting monitoring information on a local system.
Release Note
Rationale
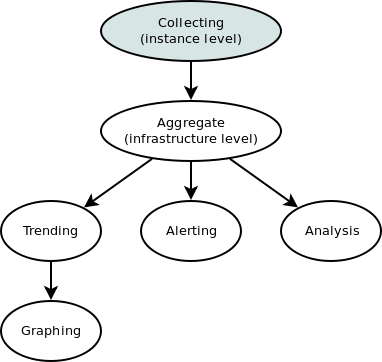
Monitoring information is a building block for providing higher level services such as trending, alerting, analysis.
User stories
- As an Ubuntu System Administrator I install packages from the Ubuntu archive. Relevant information is automatically collected on local systems.
- As an Ubuntu System Administrator I can easily write a custom measurement probe and have it integrated with the local collecting component.
- As an Ubuntu System Administrator I can use existing munin probes and have them automatically use the local collecting component.
- As an Ubuntu System Administrator I can use existing collectd probes and have them automatically use the local collecting component.
- As an Ubuntu System Administrator I have confidence I won't loose any measurements even if systems are temporally disconnected from the network.
Assumptions
Design
Overview

Collecting
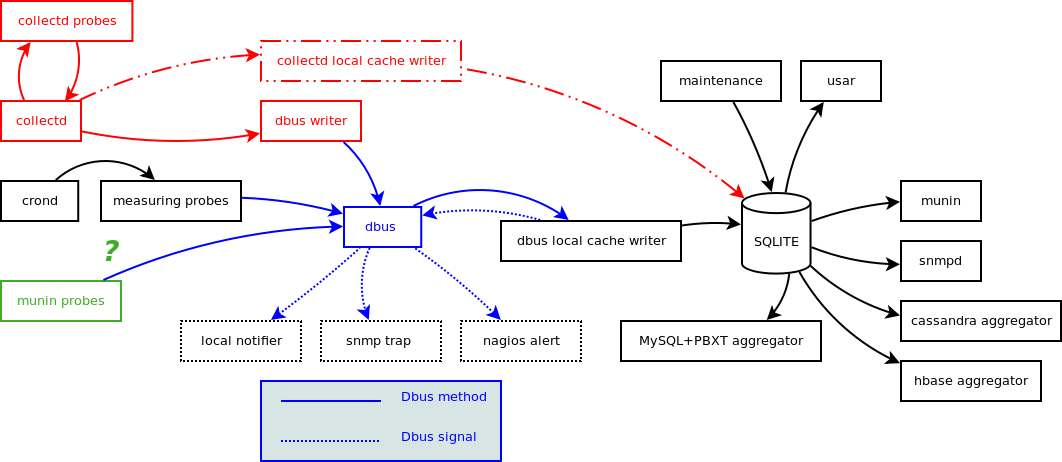
We'll focus on collecting at the local system level:

Question: Sqlite vs BDB?
DBUS local cache writer
Each measurement is send to the DBUS local cache writer via an DBUS object method in order to guarantee their storage. The measurement is then resend over DBUS as signal for other interested parties.
The DBUS local cache writer stored each measurement for each probe in a sqlite database.
Maintenance jobs are responsible for purging old measurements on a regular basis in order to not consume to much space. Maintenance can be turned off completely.
DBUS object method signature
sqlite schema
Munin probes (main) integration
Collectd probes (universe) integration
Write a write plugin to push measurements to DBUS.
usar
Write a tool to locally query the monitoring database about measures:
usar [package-name|probe-name]
Returns a list of statistics about the probes related to the package|probe name.
Implementation
Test/Demo Plan
Unresolved issues
BoF agenda and discussion
UDS Maverick discussion notes
Monitoring and graphing frameworks

Review monitoring framework.
Develop monitoring probes: one probe to rule them all (monitoring framework).
Syslog aggregation.

Drawback: RRD based monitoring: loose history.


Issues:
 1. Local collection of measurement (collection):
    - probes
    - local caching
    - access to the cache system via snmp.
 2. Framework to analyse the data (aggregation).

Use cases
 - ISP graphing/monitoring for billing purposes.

Review monitoring frameworks from a cloud perspective:
 - munin:
   in main
   Issues with archicture: not working well with cloud architecture.
    if the munin server goes down, monitoring stops.
   Good support for developing/integrating new probes.
   Probe dynamism.
   Integrates with nagios.
 - nagios:
   in main
 - collectd:
   in universe.
 - smokeping:
   in universe; simillar arch as munin
 - zenoss (https://bugs.launchpad.net/bugs/251404):
   needs packaging.
 - opennms:
   needs packaging.
   + http://demo.opennms.org/opennms/ <- demo site
   + Graphing and Performance Monitoring via JRobin (http://www.jrobin.org/index.php/Main_Page)
   + Postgres database
   Good graphing capabilities.
   + Enterprise ready
   + Active Community
   + Commercial Support available
   + Distributed Monitoring
   + Alerting via Mail, SMS, XMPP, whatever you want
   Problems:
    - Java Based (jetty/tomcat)
    - Hard to build from source
    - it needs a lot of disk IO
 - zabbix:
   in universe.
 - Chukwa (hadoop):
   needs packaging.
   does it make sense under 1000 nodes ?
   not ready yet ?
 - flapjack
 - scribe (+thrift):
   + scribe module for syslog-ng?
   + cached locally
 - CIM/WBEM:
   synchronous
 - Ganglia:
   in universe.
   rrd based.
 - Cacti:
   in universe.
   currently just graphing
   big LAMP stack on the server.
- ysar (Yahoo - not released).ServerMaverickMonitoringFramework (last edited 2010-05-27 01:17:27 by ua-178)