UnderstandingJenkins
We use Jenkins for most of our automated tests. Full documentation is available here; below we will only highlight the basic needed to navigate on our Jenkins.
We have Jenkins installed in two places:
- the real Jenkins inside our Lab (access restricted). This is where the tests are actually executed from.
the public-facing Jenkins, accessible by all. This public-facing Jenkins mirrors the tests and history that we are running (taken from the Lab's Jenkins instance). There is no need to log into this instance, since it is read-only -- and a mirror, to boot!
The Jenkins Main Page
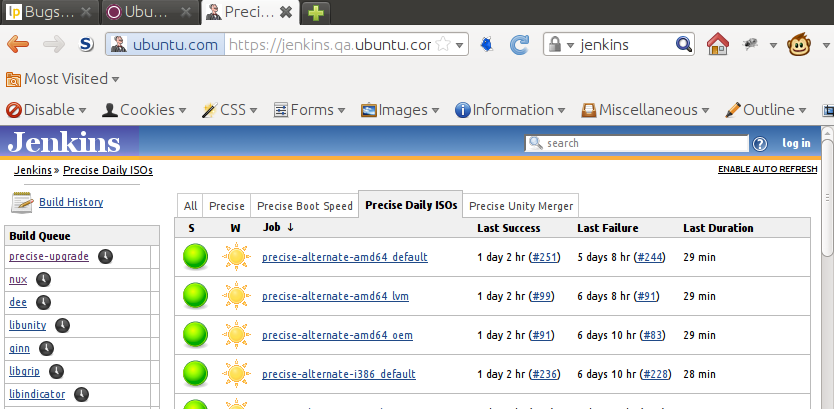
When you reach this page, you will see something like this:

On the left side you can see:
- who is defined as a Jenkins user -- and we do not need to worry about that, since the public Jenkins does not need us to log in
- a list of the last builds executed
- the current build queue -- in other words, what jobs are currently waiting to execute on the internal Jenkins. Clicking on one of the Build Queue links will show you the same page as clicking on the same-named entry on the Tabs area
On the right side you have a series of tabs (at the top). The first one on the left is always called 'All', and lists all defined Jenkins jobs. We expect this list to get large as we implement more and more tests.
Selecting a tab will show only the jobs that we aggregated for this tab. This is usually where we spend our time... each one of us looking at a specific subset of Jenkins job we are -- at the moment -- interested in.
The column titles in this are are all clickable, and will cycle the sorting into, ah, alphabetic and inverse alphabetic order. The default ordering is ascending on Job name.
They mean:
S -- Job status: can be green, yellow, red, or gray.
- green -- test succeeded.
yellow -- test returned some failures, but overall did not fail.
- red -- test failed. Really.
- gray -- test has never been run (yet...)
W -- another representation for success/failure, drawing from weather icons. These icons are better to represent a trend, going from a
 (all good, and has been that way for a while) to
  (failing, and has been failing for a while).
 Job -- the job name for this test
Last Success -- how long ago was this test last successful
Last Failure -- how long ago Jenkins recorded the last failure on this test
Last Duration -- how long did the last test take to run
Looking at a set of builds
So. If you click on a specific tab -- say, the Precise Daily ISOs, you get to see something like this:

Looking at one specific job
![]() the following is valid on any tab; we will keep on with the Precise Daily ISOs just to make (my) life simpler.
the following is valid on any tab; we will keep on with the Precise Daily ISOs just to make (my) life simpler.
Now, if you select one of the jobs shown -- anyone will work --, you will see something like:

On the left we have the Build History, listing all builds of this job still known (i.e., archived) by Jenkins. Each of these builds is a link to a detail page on the build itself. This is where usually you will end up...
![]() if you are looking for a failure, you really do not want the Last Successful Artifacts link, or any of the bullet links under it
if you are looking for a failure, you really do not want the Last Successful Artifacts link, or any of the bullet links under it ![]()
To the right you will see -- what we are really interested on --, under Permalinks, links to the last:
- build,
- stable build,
- successful build,
- failed build, and
- unsuccessful build
Some of the above links may be identical (for example, when the last build also stable, or successful, etc).
Looking at a Specific Job instance (run)
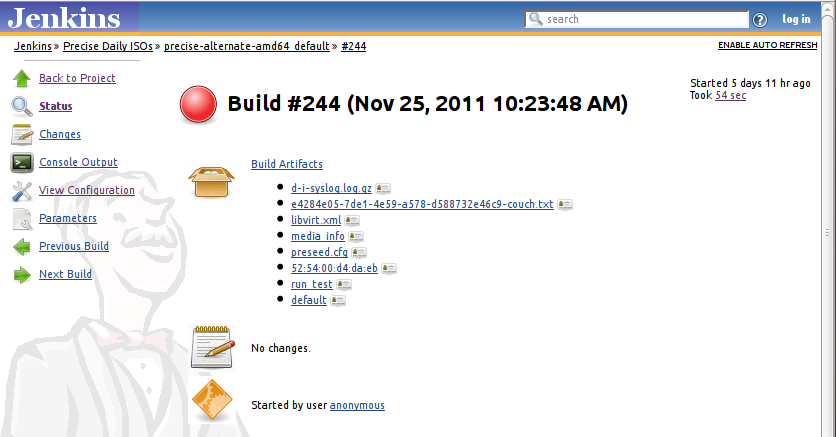
First of all, it does not really matter if you selected a job instance by clicking in the left box on the above screenshot, or by selecting one of the Permalinks -- both will put you on the same place.It also does not matter if you select a successful, unsuccessful, or failed run: the data shown is similar. You will end up with something like:

What we are usually interested in are the Console Output link, on the left, and the Build Artifacts, on the right.
The console output will show details of this job run -- in fact, all output the main test script for this job prints out. This is usually left, by us, in debug mode, and it is quite verbose.
The test artifacts link will jump to another page, showing all the data collected on this job run. This data will vary per test type. We are usually interested in the test-results link. The amount of resulting links (and data) usually vary with the end state of the job run: a successful run usually has more attachments to be shown.
QATeam/AutomatedTesting/UnderstandingJenkins (last edited 2011-12-14 14:43:50 by 94-192-45-141)